A modern dashboard tracking glucose levels and overall fitness to help people with diabetes monitor their glucose and overall health.
ROLE
Designer, Researcher
TEAM
3 members
TIMELINE
10 weeks
STACK
Next.js, FastAPI, Supabase, FHIR, OpenAI
DELIVERABLES
Deployed web app
Final Dashboard

Interactive Embedded Prototype Below
01
THE
PROBLEM
Managing diabetes means keeping track of a lot at once. Patients must track glucose, insulin, labs and lifestyle, but that data is scattered across multiple tools. That makes it hard to understand trends and act early.
There is a gap in providing one location to inform patients of everything they need at a glance.
02
RESEARCH
Instead of user interviews, we grounded the project in academic literature on diabetes self-management and health dashboards.
830 million
people worldwide are affected by diabetes, according to the World Health Organization [1].
The condition
Two types, one more common
Diabetes occurs when the pancreas can't produce enough insulin (Type 1) or the body can't use it correctly (Type 2). Type 2 is far more common and develops later in life, with a lack of exercise and genetics among its contributors.
Treatment [3, 4]
Daily management is on the patient
Treatment combines insulin, other medications and a healthy lifestyle. Untreated diabetes can lead to heart attacks, strokes, and nerve and eye damage, so patients need to stay on top of treatment and catch complications early.
Existing tools [5]
Insulin tools exist, but stop there
Blood glucose and insulin tracking are essential, and dedicated dosing tools already cover them. What's missing is a holistic view that also includes other medications, lab results, weight and lifestyle.
We used the Synthea Generated Synthetic Data in FHIR dataset. Synthetic records that follow the FHIR standard let us respect HIPAA, avoid limits on data access, and still test, model and demo the app with realistic patient histories.
03
SOLUTION
A patient-facing dashboard with a more holistic approach: patients can track other medications, lab results, weight and lifestyle alongside glucose and insulin. Using the FHIR API, it shows past trends and relevant medical information, and a chatbot lets patients ask simple questions about their own data.
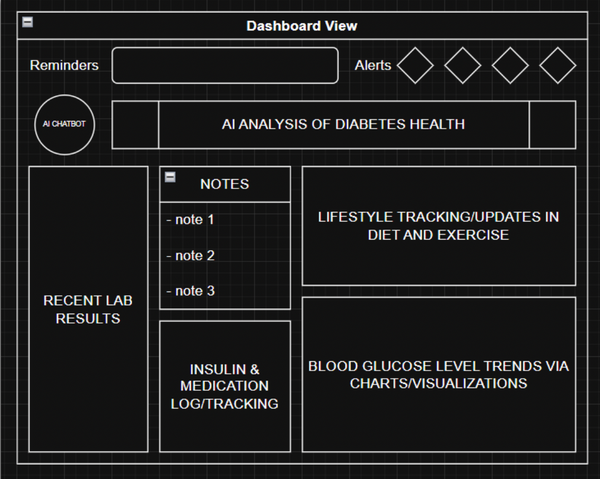
DASHBOARD
Everything on one screen
Our first layout put reminders, alerts and an AI analysis of the patient's health at the top. Below sat recent lab results, notes, an insulin and medication log, lifestyle tracking, and blood glucose trend charts.
04
HOW IT
WORKS
We chose these tools for their ease of use and widespread support. Patients use an interactive frontend to see their medical information and track diabetes metrics. The backend provides that data, stores what users enter so it persists, and makes calls to an LLM. We planned to host on Vercel and ended up deploying on Railway.
FRONTEND
Next.js
React in TypeScript
BACKEND
FastAPI
Python
DATA
Supabase + FHIRPostgreSQL database, plus Synthea patient records through a FHIR API
AI
OpenAI API
Powers the chatbot

05
PROCESS
We planned the build as four sprints and tracked every high-level task on a Kanban board in GitHub Projects, with the dependencies and risks for each one.
SPRINT 1
Project setup & data integration
-
Next.js frontend and FastAPI backend
-
Supabase database and authentication
-
FHIR API and Synthea dataset
-
Database schema for tracked metrics
SPRINT 2
Core dashboard
-
Layout, navigation and patient summary header
-
Blood glucose time-series charts
-
Insulin, medication and HbA1c views
-
Weight and lifestyle tracking
SPRINT 3
AI chatbot
-
OpenAI API integration
-
Chat interface inside the dashboard
-
Prompts that use the patient's own data
-
Guardrails for medical questions
Risks we planned for
SPRINT 4
Polish & deployment
-
Secure sign-in and sessions
-
Visualization and UI styling
-
Integration and usability testing
-
Deployment and demo walkthrough
RISKS WE PLANNED FOR
06
WHAT
WE BUILT
A fully deployed app (via Railway) with real-time visualization of glucose trends, and working medication tracking, lab results and lifestyle tracking.

LOG HEALTH
One place to record everything
Patients tap a tile to open a focused logging screen for blood glucose, HbA1c, insulin, medication, exercise or sleep.
TRENDS
See where your numbers are heading
Blood glucose and HbA1c readings are charted over time, with the latest value called out, so patients can spot a trend and act early.


LIFESTYLE
Exercise and sleep next to the medical data
Patients log activity type, duration and time, and hours of sleep. Recent entries show as bars so patterns are easy to compare.
07
NEXT STEPS
IN PROGRESS
-
AI chatbot guardrails and prompt refinement
-
Authentication and session management
-
UI/UX improvements to the dashboard